Swelleye provides detailed and accurate surf forecasting for more than 40 surf spots in Taiwan. In this article,
we're going to explain exactly how to read Swelleye's surf forecast.
If you're new to surf forecasting and haven't read our first article, "How to Read a Surf Forecast, Part 1," we suggest you read that first. It will explain the basics of surf forecasting.
So let's get into the detail of the Swelleye forecast, starting with the daily tabs.

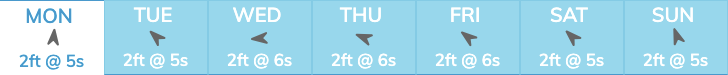
The tabs at the top of the forecast show 9 days of surf forecasts, including the current day. Click on a tab and it will show that day's forecast.
Arrows
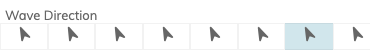
The arrow denotes the wave direction (the average direction for the entire day).
2 ft @ 5s
Below the wave direction arrow is the
average wave height
and
average wave period
(s = seconds) for that day.
It would be spoken as “
2 feet at 5 seconds
.”


The 24-hour forecast is broken up into 2-hour periods.
00
= 00:00 until 01:59
02
= 02:00 until 03:59
04
= 04:00 until 05:59
06
= 06:00 until 07:59
. . .
16
= 16:00 until 17:59
18
= 18:00 until 19:59
20
= 20:00 until 21:59
22
= 22:00 until 23:59
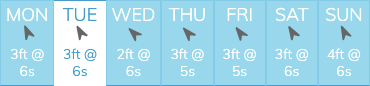
The column with the gray background and blue border is the current time period.
So that you get the most accurate and timely data, our forecasts are updated hourly.


For
wave height
, our forecast shows the
Significant Wave Height. It is normal for waves to vary in height from one wave to the next.
To give you an idea of the range of waves to expect at a given time, Swelleye provides the Significant Wave Height in our surf forecasts and surf reports.
Significant Wave Height is the average of the highest one-third (33%) of waves (measured from trough to crest) that occur in a given period.
This is measured because the larger waves are usually more significant than the smaller waves. Since the Significant Wave Height is an average of the largest waves, you should be aware that many individual waves will be higher.
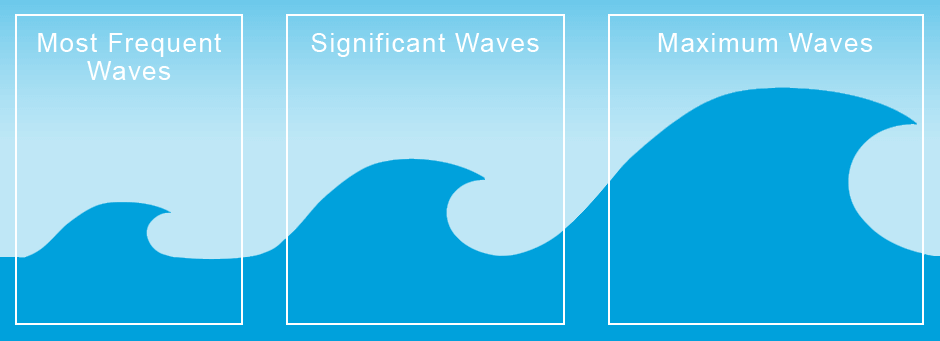
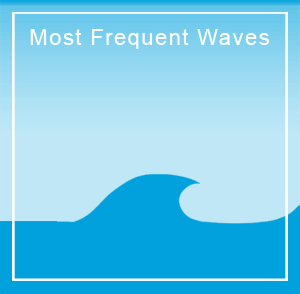
Most Frequent Waves
The most frequent wave height will be about half the height of the significant wave.
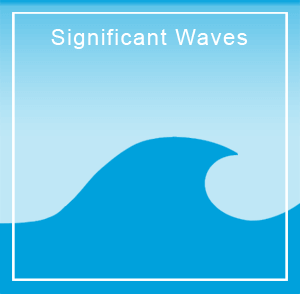
Significant Waves
Approximately 14% of waves will be higher than the Significant Wave Height (approximately 1 in every 7 waves).
Maximum Waves
It is normal to expect a wave of twice the height of the significant wave approximately 3 times in 24 hours. You need to be prepared for a wave of this height before heading out into the water!
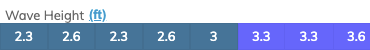
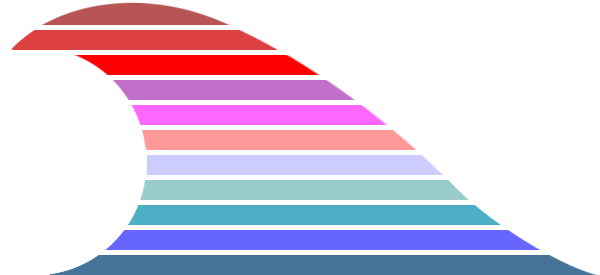
Wave Height Legend
The wave height on our surf forecast is color coded. The following legend shows the wave height ranges and their associated colors:
9.0
7.9
7.0
6.0
4.9
4.0
3.0
2.0
1.5
1.0
0.5
30
26
23
20
16
13
10
6.6
5.0
3.3
1.6
9.0
7.9
7.0
6.0
4.9
4.0
4.9
3.0
2.0
1.5
1.0
0.5
30
26
23
20
16
13
10
10
6.6
5.0
3.3
1.6
For example, if the wave height is 6.9 ft , the background color will be cyan . If the wave height is 12.8 ft , the background color will be light blue .
Changing Wave Height Units
You can change the height units by clicking on it. The following units are available:
m
= meters
ft
= feet


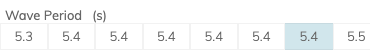
Wave Period is the time it takes, in seconds, for successive waves to pass the same fixed point. Swelleye’s wave period reading is the mean period of the swell. Therefore, some wave sets will have a shorter period between waves, other sets will have a longer period between waves.
s = seconds
Note that we include a decimal for this reading. This is because there could be a noticeable difference in wave height and quality between a wave period of 9 seconds and one of 9.9 seconds.


The
Wave Direction
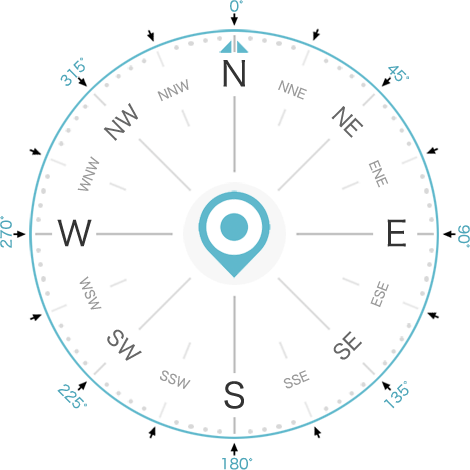
arrows show from which direction the dominant waves are coming from, and point in the direction in which the wave is traveling towards.
If you hear someone say that there is a southeast (SE) swell, that means that the wave is coming from the southeast (SE or 135°) and traveling towards the northwest (NW or 315°).
In the diagram below, the black arrows represent the wave direction arrows you see on our forecast:


The speed of the wind can either destroy the waves or improve them
(depending on the
wind direction
). Generally speaking, it’s better to have little to no wind so that the face of the wave is nice and smooth. However, a light offshore wind can help “hold up” the wave and make it barrel. In contrast, a strong onshore or cross-shore wind can “push down” the wave, making it fatter and more difficult to surf.
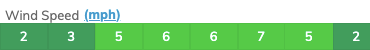
Wind Speed Legend
The wind speed on our surf forecast is color coded. The following legend shows the wind speed ranges and their associated colors:
28.6
26.8
24.6
20.0
17.8
16.0
13.8
12.0
9.8
8.0
5.8
4.0
1.8
0
103
96.5
88.5
72.4
64.4
58.0
50.0
43.4
35.4
29.0
21.0
14.5
6.4
0
64
60
55
45
40
36
31
27
22
18
13
9
4
0
55.6
52.0
47.8
39.0
34.7
31.3
26.9
23.5
19.0
15.6
11.3
7.8
3.5
0

For example, if the wind speed is
12 mph
, the color will be
green
. If the wind speed is
13 mph
, the color will be
yellow
.
Generally speaking, the green range is ideal. Yellow is okay, and can be quite good depending on the surf spot and other variables. Orange to red tends to be “blown out,” meaning the wind has rendered the wave too messy and choppy to surf.
You can change the wind speed units by clicking on it. The following units are available:
m/s
= meters per second
mph
= miles per hour
kph
= kilometers per hour
kn
= knots


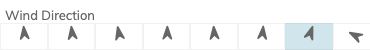
The Wind Direction arrows show from which direction the dominant wind is coming from, and point in the direction in which the wind is traveling towards.
The direction of the wind is represented the same as the wave direction above, so refer to the the direction diagram above.


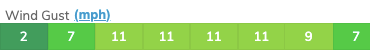
Just as it’s important to know what the wind speed is, it’s almost even more important to know what the Wind Gust speed is . For example, a wind speed of 8 mph would normally be okay for surfing, depending on the swell and conditions. However, if the wind gust speed at that time is 18 mph, that could make for really poor, messy surf conditions.
The wind gust uses the same colors as in the wind speed legend above.
You can change the wind gust units by clicking on it. The following units are available:
m/s
= meters per second
mph
= miles per hour
kph
= kilometers per hour
kn
= knots


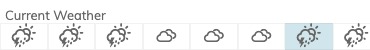
Weather shows an icon of the forecasted weather conditions (i.e. sunny, rainy, etc.).


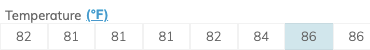
The Temperature shows the forecasted air temperature. The Temperature is calculated for 6 feet above ground.
You can change the temperature units by clicking on it. The following units are available:
°C
= Celcius
°F
= Fahrenheit


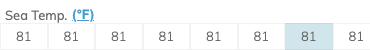
The Sea Temperature shows the water temperature of the sea, from sea surface down to approximately 10 feet below the surface.
Note that water temperatures at the beach might be slightly warmer than indicated by the Sea Temperature reading.
We’re lucky in Taiwan, as the water temperature doesn’t fluctuate very much throughout the year. Since Taiwan is located in the Tropics/Subtropics, direct overhead sunlight keeps surface waters consistently warm throughout the year. In Southern Taiwan, you can get away with wearing boardshorts and a rash guard all year!
Sea Temperatures in Taiwan
Following shows the
warmest
sea temperatures (July) and
coldest
sea temperatures (January) in Taiwan:
North:
84°F
/
64°F
Northeast:
84°F
/
68°F
East:
86°F
/
72°F
South:
86°F
/
73°F
Southwest:
86°F
/
72°F
Northwest:
81°F
/
63°F
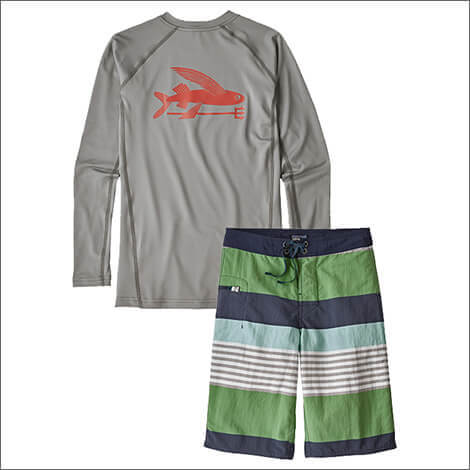
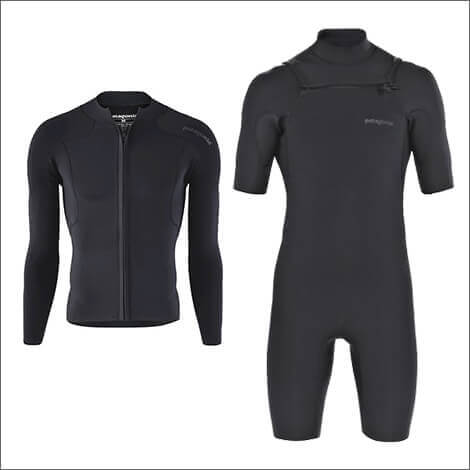
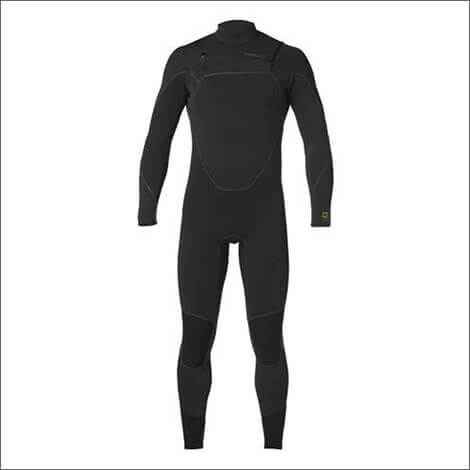
Wetsuit GuideWetsuit Guide


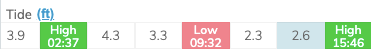
The last row on the forecast shows the Tide data. Low Tides are in red and High Tides are in green.
Viewing Low / High Tide Times
You can toggle between low tide/high tide times and heights by hovering over (clicking on mobile) the Tide row.
Normally, you will see 2 low tides and 2 high tides per day, called “Semi-Diurnal” tides. However, sometimes you will see only 1 low tide and 1 high tide. These are called "Diurnal" tides, and occur when the gravitational pull of the sun and moon are in alignment.
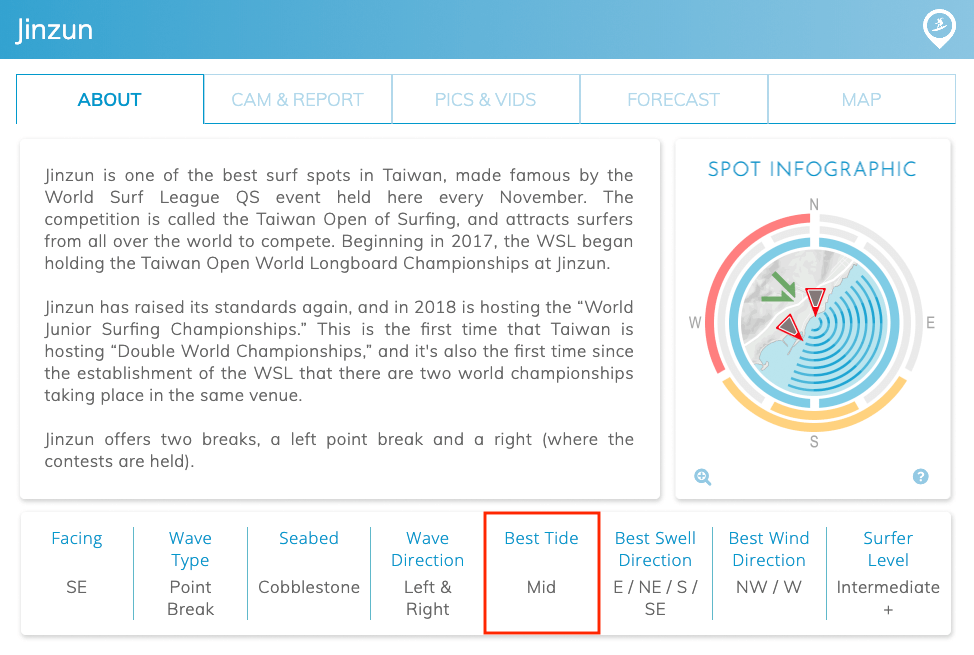
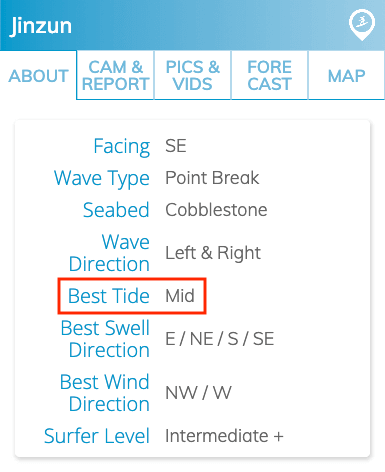
To know the best tide for your surf break, see “Best Tide” in the “About” tab for that surf spot’s page (
example page
).
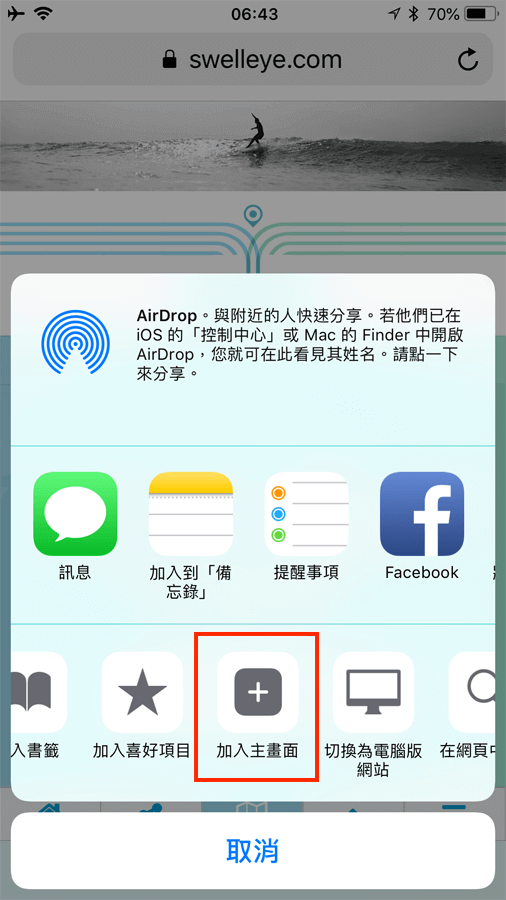
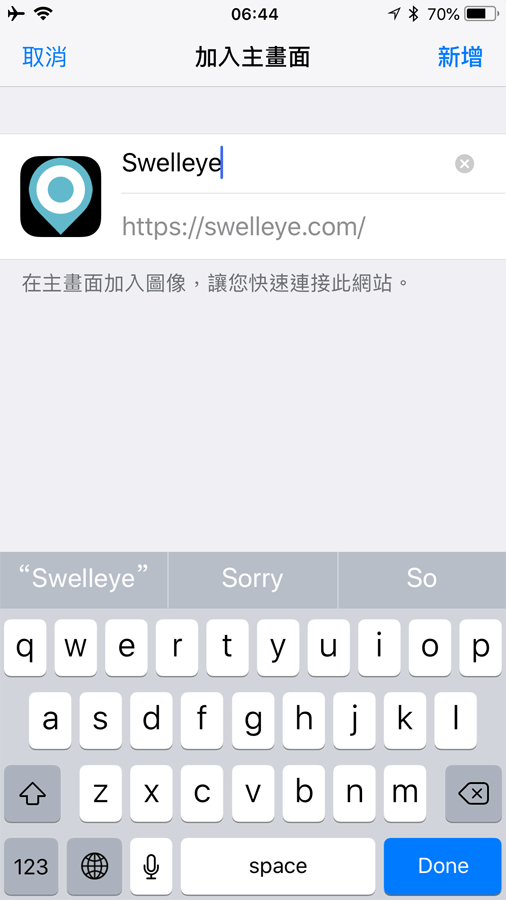
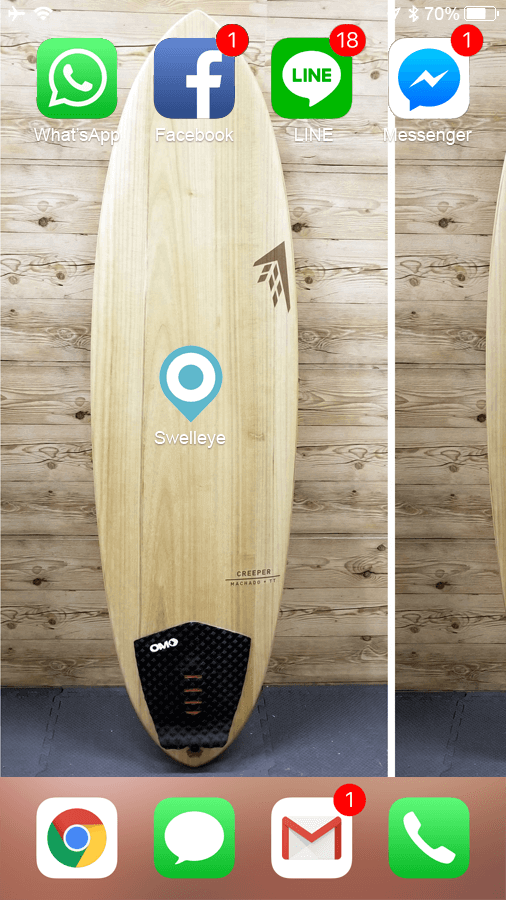
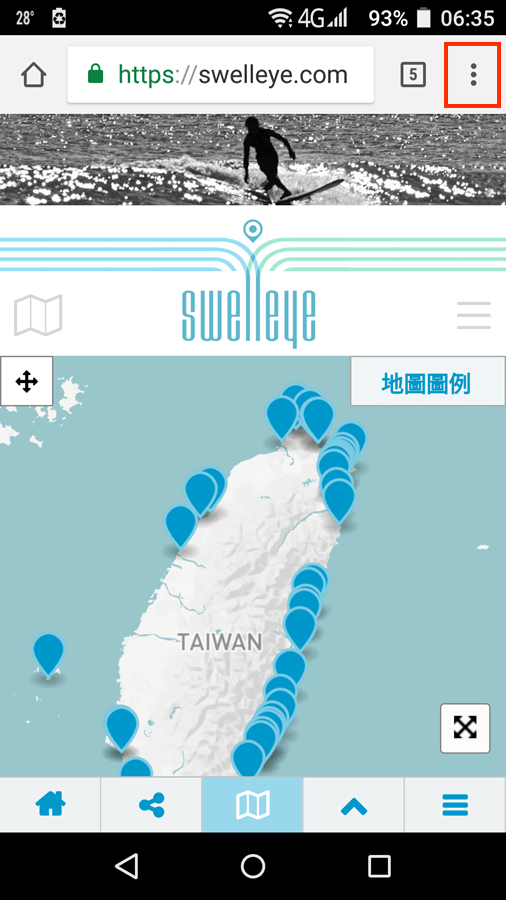
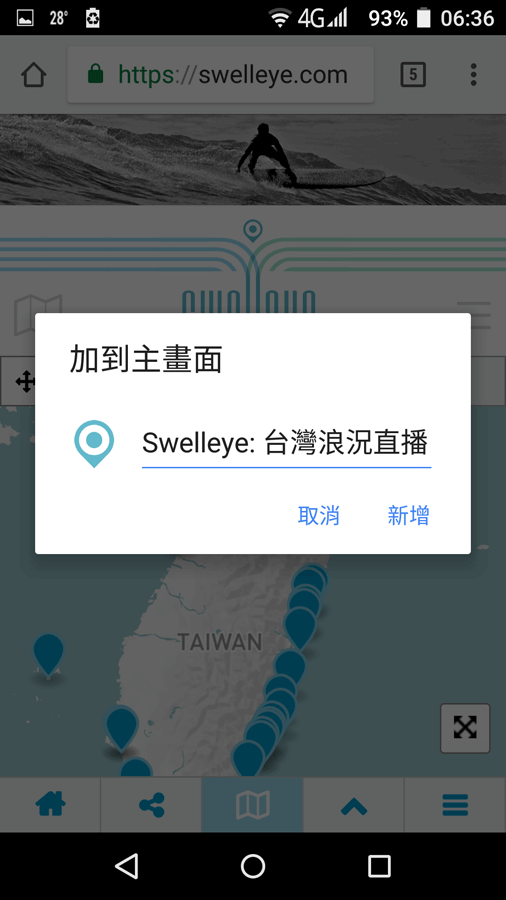
Create Forecast Shortcut on Mobile Device’s Home Screen
If you would like to easily access our forecasts (or any page on our website), you can create a shortcut icon on your mobile device’s home screen.

If you have any questions about reading our surf forecast, please leave a comment below (or contact us ) and we’ll reply as soon as possible.
Related Articles: